Contents
Or how to win more money by comparing your stats to winning players
Leak explorer
- Finds potential leaks by comparing your stats with the stats of winning opponents in your database
- Shows you how your play varies by position
- Shows you which hands winning opponents play more or less often than you
- Shows how your play changes over time
Explore Leaks
When you open Range Wizard you have three options.
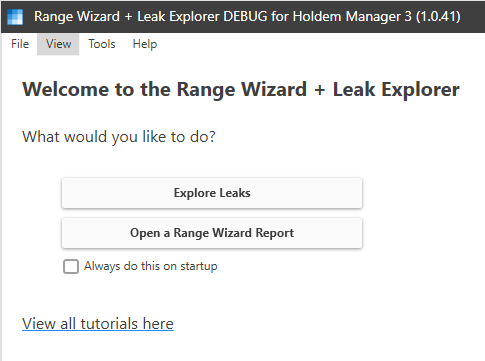
Select “Explore Leaks”. Range Wizard will begin searching for leaks.
When it finishes you see a list of stat categories on the left and the stats contained by the selected category on the right.
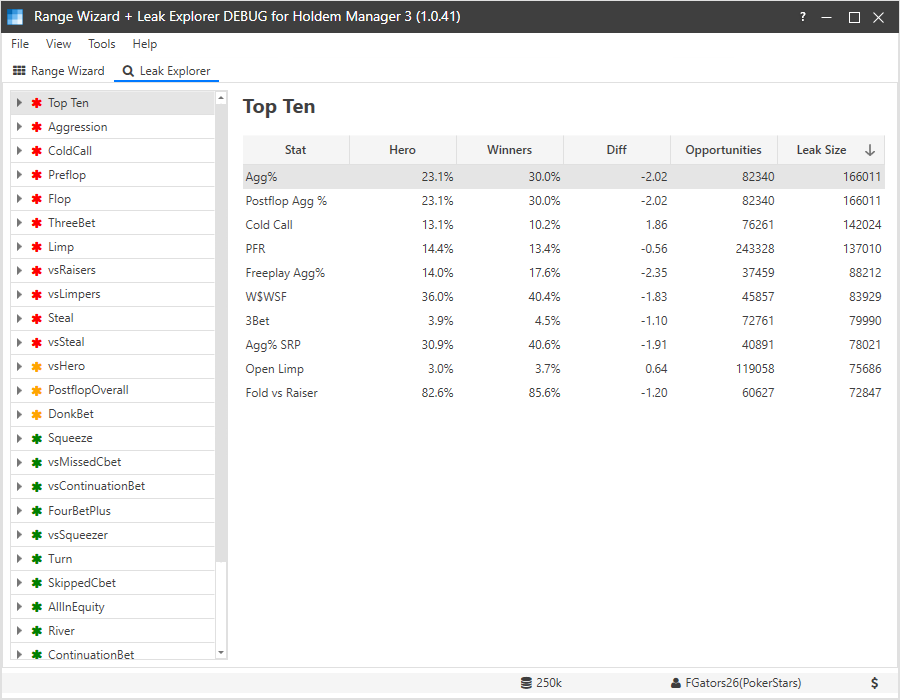
The first category contains the top ten biggest potential leaks found.
The list of categories is sorted by the leak size of the stats it contains. The green icons indicate the largest leaks, yellow are medium leaks, and green are small leaks.
Explore a Leak
To explore a leak, click on the arrow to the left of a category to expand the category
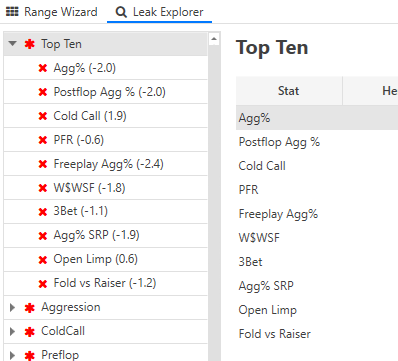
The number in parentheses to the right of the stat indicates the size of the leak relative the the winning players mean. A negative value means you are tighter than the mean and a positive value means you are looser than the mean.
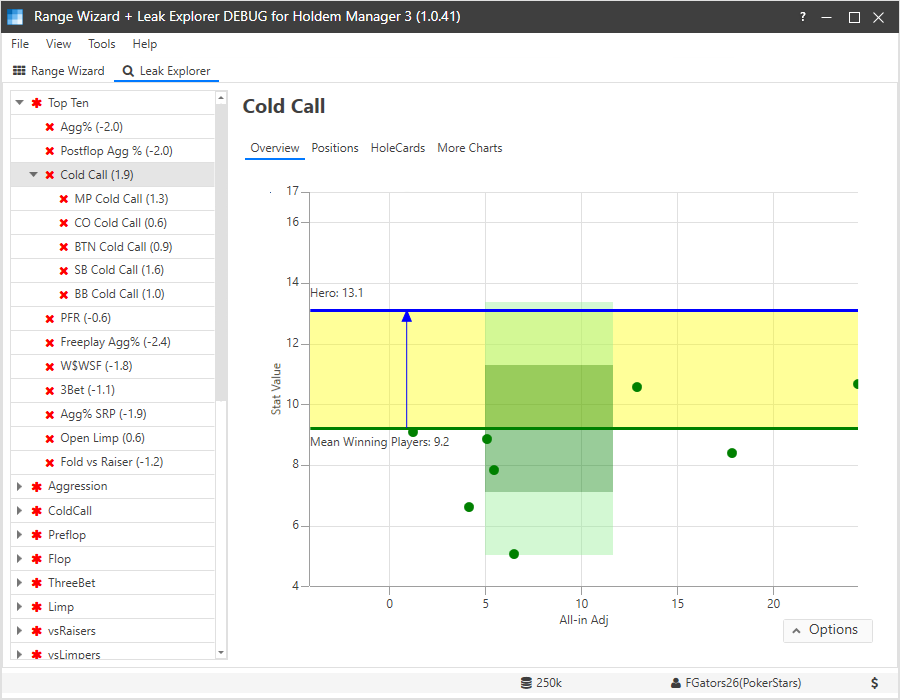
Next, click on the category you want to explore. In this tutorial we will explore the Cold Call leak.
If the stat includes positions it will expand to show them.
The right view shows details about the selected leak. It has several views.
- Overview – quick visual of the leak
- Positions – stat values broken down by position (where available)
- Hole Cards – compares hand ranges between you and the opponents (preflop only)
- More Charts – additional time-based charts
Overview
The overview shows how your hand range compares to the winning opponents average hand range.
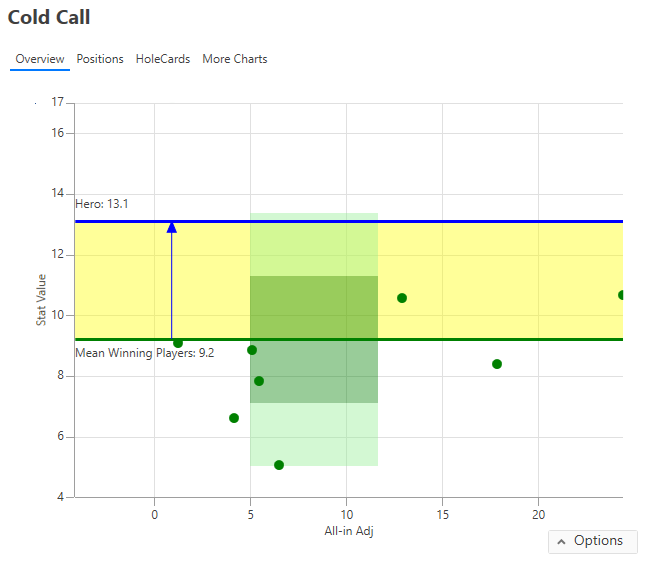
Hero and Opponents
The blue horizontal line is the hero’s stat value. The green horizontal line is mean the winning opponents’ stat value.
The blue arrow indicates the direction of the difference. Up is looser than the mean, down is tighter than the mean.
The green dots represent each opponent that was included in the comparison. The horizontal (x-axis) position of each dot is the opponent’s all-in adjusted EV. The vertical position (y-axis) is each opponent’s stat value.
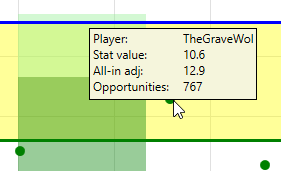
Hovering your mouse over a dot will display that player’s details.
Hero and Opponents Average Stat Value
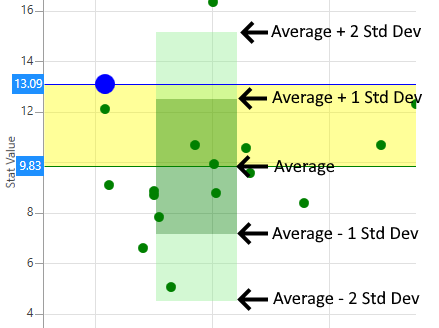
Opponent Standard Deviations
The dark green background represents the average opponent value plus or minus 1 standard deviation.
The light green background represents the average opponent value plus or minus 2 standard deviations.
From Wikipedia:
In statistics, the standard deviation is a measure of the amount of variation or dispersion of a set of values.[1] A low standard deviation indicates that the values tend to be close to the mean (also called the expected value) of the set, while a high standard deviation indicates that the values are spread out over a wider range.
In other words, the more the opponents agree on the “best” value, the smaller the standard deviation.
The size of the leak is computed using the difference between the hero’s value and the average opponent’s value in standard deviations. This provides a convenient way to compare the leak size between different stats.
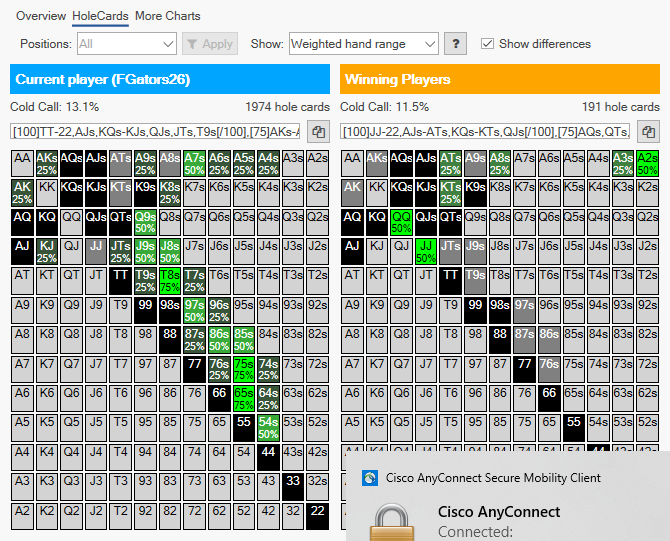
Hole Cards View
The Hole Cards view is basically the same as report hole cards view. The only difference is it always show the selected leak’s stat so you cannot select a different stat.
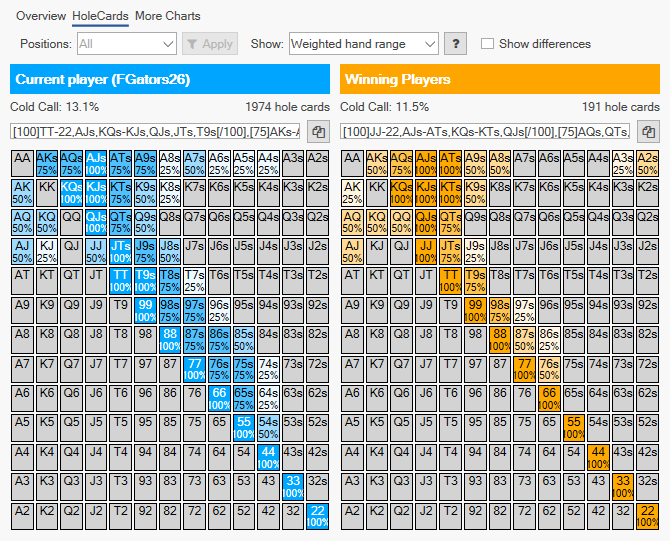
Check “Show differences” to see how your hand range compares to the average winning opponents hand range.