
Contents
This tutorial will teach you how to build a simple report that compares winning players to losing players.
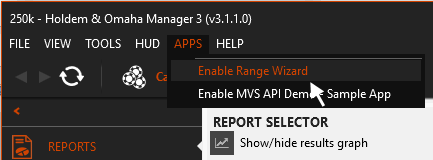
Step 1. Start Range Wizard
In Holdem Manager 3, start the Range Wizard app by selecting “Enable Range Wizard” on the Apps menu.
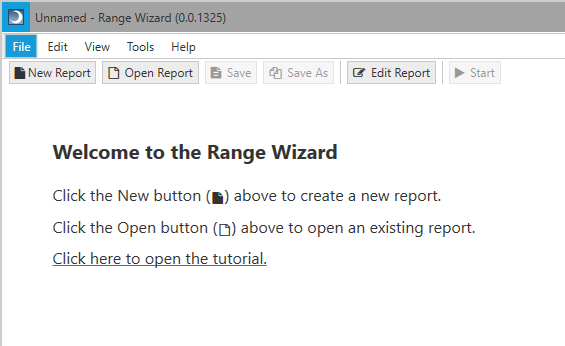
If this is the first time you have opened Range Wizard, it will display a welcome screen.
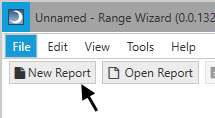
Step 2. Create a new report
Press the “New Report” button on the Range Wizard toolbar to create a new report.
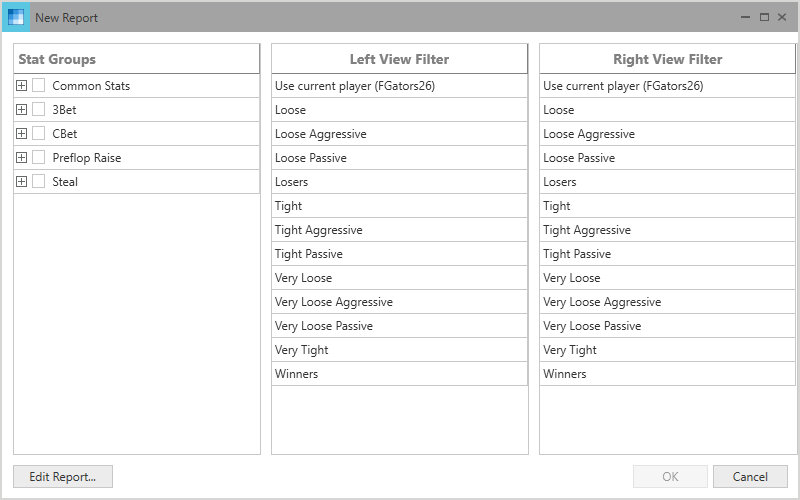
This opens the new report window.
Step 7. Run the queries
You have selected the stats you want to include in the report and the filters you want to apply to select players. Now you are ready to run the queries and see the results. Press the “OK” button to start running the queries.
The Range Wizard window will display three tabs: Players, Hole Cards, and Reports. As the queries run, each view on the Players tab will begin to fill with players that match the view’s player filters.
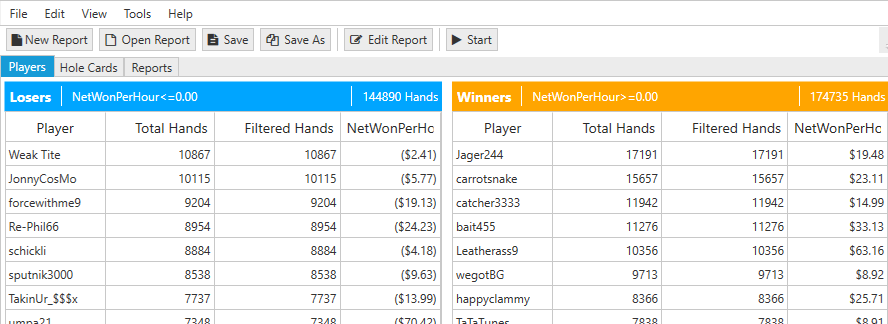
The queries stop when the maximum number of players for both views, as set in the filters page, are reached.
The headers contain a summary of each view’s filter. Note that the left view contains only losing players and the right view contains winning players.
Step 8. View the hole cards reports
Select the “Hole Cards” tab to view the hole cards page.
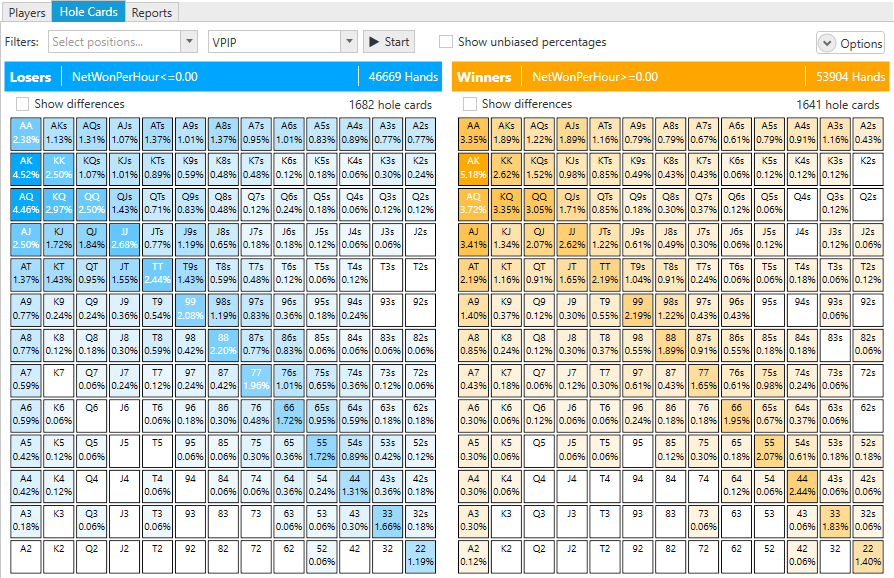
The hole cards grids show the relative frequencies each hand was shown down. The lighter the grid cell, the more often the hand was shown.
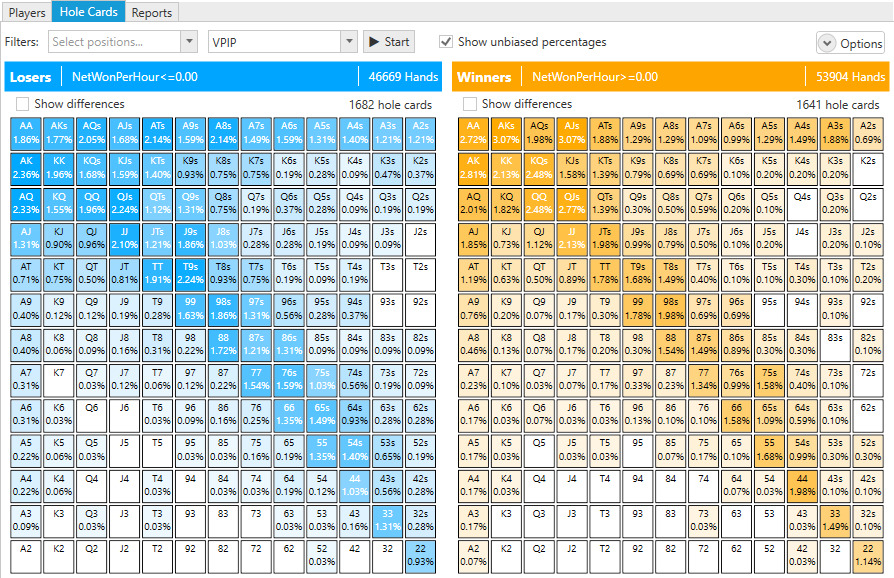
Since unsuited hands occur more frequently than suited hands, the grid is biased toward unsuited hands. Check the “Show unbiased percentages” check box to see percentages that are adjusted to remove the bias.
Check the “Show differences” check box to see the difference between the two grids.
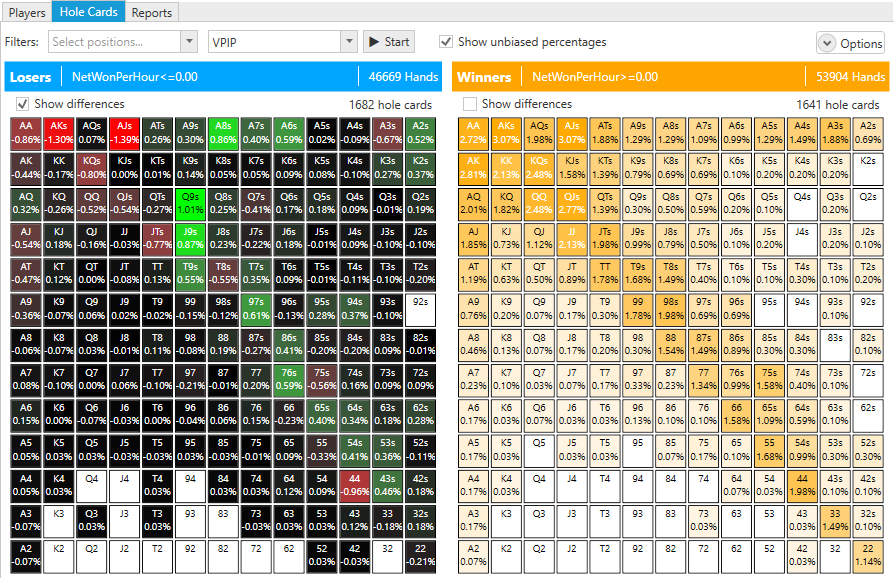
The green cells indicate hands that were shown down more often than the other view. The red cells indicate hands that were shown less often.
Step 9. View the stats report
Click on the “Reports” tab to view the stats report.
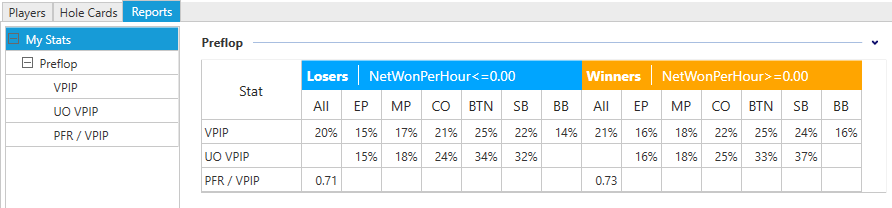
The reports page displays the combined stats of the players in each view. You can use the stat tree on the left to see more detailed views of each stat.
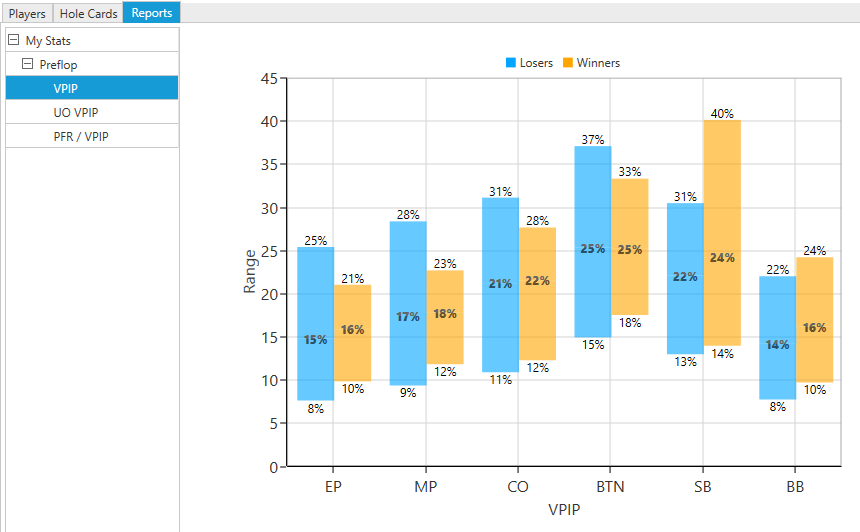
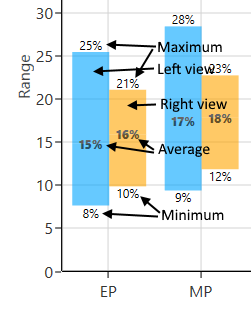
The stat details shows the maximum, average, and minimum value for each stat position. Views are displayed side by side for easy comparison.
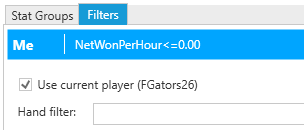
Step 10. Compare your stats with others
Now let’s compare your stats with winning players. Click the “Edit Report” button on the tool bar to open the report editor. Select the Filters tab and check the “Use current player” check box in the left view. You may want to rename the view since the current view name is obviously no longer accurate.
Click “OK” to start running the queries. The reports will show your stats in the left view and winning player stats in the right view.
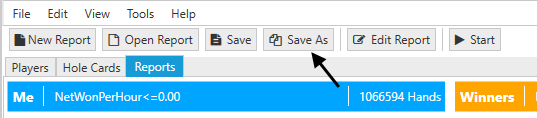
Step 11. Save the report
Saving the report to your hard drive allows you to open it again later. Click the “Save As” button on the toolbar to save your report.
Enter a name for your report and click the “Save” button. Now you can load your report by clicking the “Open Report” button on the tool bar.